KVANT SPECTRA Manuel utilisateur

SPECTRA
USER MANUAL

1
CONTENTS
COMPOSITION OF THE TEACHING AID 2
SPECIFICATION AND USE OF THE DEVICE 2
Technical Specifications 3
SOFTWARE INSTALLATION 3
HOW THE SPECTROMETER WORKS 3
CALIBRATION 5
USER INTERFACE 6
THE MAIN SCREEN 6
1SPECTRUM SETUP 6
2SPECTROMETER CONTROL 7
3GRAPH 8
4GRAPH SETTINGS 8
5SPECTROMETER CALIBRATION 11
MEASURING 14
EMISSION SPECTRUM 14
REFERENCE SPECTRUM, DIFFERENCE 15
REFERENCE SPECTRUM, RATIO 15
EMISSION SPECTRUM –calibration sources 16
SYSTEM REQUIREMENT 17
RECOMMENDED SYSTEM REQUIREMENTS 17
SOFTWARE (OPERATING SYSTEM) 17
HARDWARE 17
WARRANTY LETTER 17
WARRANTY PERIOD 17
WARNING 18
DATE OF SALE 18

2
COMPOSITION OF THE TEACHING AID
Spectra (High Resolution Spectrometer) in plastic box.
Set contains:
•spectrometer with USB power cable,
•optical fiber,
•lens,
•software Spectra v5.
SPECIFICATION AND USE OF THE DEVICE
The Spectrometer SPECTRA is an easy-to-use USB spectrometer, which allows the recording and evaluation
of spectral properties of sources, transparent and light-reflecting surfaces of various materials in the range of
wavelengths 380 - 900 nm. The device is supplied with an optical fiber with SMA connectors and a collimator.
The spectrometer does not need a separate power supply, it is powered via the USB port of a personal computer
and the SPECTRA v5 software controls it.

3
TECHNICAL SPECIFICATIONS
Sensor: 1/3" Color CMOS Sensor Graphics resolution: 1.3 M, 1280 x 720 pixels
Spectral range: 380 –900 nm Optical resolution: < 1.5 nm FWHM
S / N ratio: 45 dB (full signal) A/D resolution: 8-bit Frequency
SOFTWARE INSTALLATION
BEFORE YOU START INSTALLING THE PROGRAM, MAKE SURE THAT THE PERSONAL COMPUTER ON WHICH
THE PROGRAM IS GOING TO BE INSTALLED MEETS THE INSTALLATION REQUIREMENTS (CHAPTER SYSTEM
REQUIREMENTS).
1. Before installing the spectrometer, uninstall all previously installed versions of the application.
2. Download the installer from https://www.kvant.sk/apps/spektrometer/spectra.exe
3. Choose a location to store your application files, follow the on-screen instructions, and proceed with
the application installation.
4. Connect the spectrometer to the USB port (if it is not already connected).
5. When the spectrometer is connected to the computer, the system detects the new USB device and
configures it automatically.
HOW THE SPECTROMETER WORKS
Light enters the Spectrometer through the SMA connector or via a flexible fiber optics cable. The light passes
the entrance slit, grating and through an objective lens it hits the surface sensor of the USB camera. The
specially selected transmission grating with fine trimmed entrance slit guarantees the high resolution and good
reliability of the results.

4
The lens displays an entrance slit in the spectral components of the input light to the camera sensor. The camera
record can be used as a current source of information or for analysis without the use of a camera after saving
in image format. The height of the spectrum corresponds to the enlarged image of the entrance slit and it is the
same for each spectral component. The spectrum covers approximately 1/3 of the camera recording area. The
part of the record highlighted with a white strip is graphically evaluated. Its position and width can be selected
in the software (spectrometer control).
The SPECTRA spectrometer from KVANT is intended for teaching and qualitative analysis of spectral
properties of various types of substances and light sources.
As the light detector, a CMOS sensor with an RGB colour registration is used. It generates R, G, and B signals
with values between 0 and 255 (8-bit digitalization of the electrical signal level. The advantage is an acceptable
price and a suitable communication protocol for processing the measured data.
The graph below (the light intensity versus pixel number) shows the RGB outputs of the Spectrometer when
recording the spectrum of a white light source.
For creating a final spectrum, the total light output is interpreted as the maximum value of maxRGB components
R, G, and B. This may be seen as a limitation of this measurement technique because the final spectrum is not
smooth but has “valleys” as shown on the graph below. It can be removed by mathematical adjustment
(correction in the spectrometer control section).

5
The correction - the alignment of the RGB envelope is adjusted by the optimal polynomial.
The Spectrometer delivers a video image (1280 by 720 pixels) of the final spectrum. Each of the 1280 columns
of the record is assigned a wavelength by calibration. Light intensity (in a.u. units (arbitrary unit)) for a given
wavelength is calculated as the arithmetic mean of the values from the selected lines of the record.
CALIBRATION
Each Spectrometer device has its own specific 3-point
calibration written at the bottom of the device.
When the spectrometer is connected for the first time,
the system will ask you to enter calibration points. The
calibration points of the pair of px, nm written at the
bottom of the spectrometer are inserted into the dialog
window. Through these calibration points the calibration curve is translated to convert the pixels of the camera
record into wavelengths of light.
The calibration for the given device is remembered after clicking CALIBRATE and is saved for further use in
the file calData.txt, which is located in the default folder. After calibration, the spectrometer is ready for use.

6
USER INTERFACE
THE MAIN SCREEN
The main screen consists of several sections: 1Spectrum Setup, 2 Spectrometer Control, 3 Graph, 4 Graph
Settings, 5 Spectrometer Calibration.
Application user interface
1 SPECTRUM SETUP
On the left side of the application is a preview window where the current record from camera or folder is
displayed. The position and width of the selection for graphic display are visible.
Selected part of the current record with saturation signalization of graph is displayed at the top of the
application. When the signal is oversaturated, it changes colour to red.
1
3
2
5
4

7
You can select a spectrum source in two ways:
1. Select a spectrum from a file –image recording format, the path to the source file is displayed in a white
window with the name of the selected file.
2. Select a camera - current observation and graphical display of the output from the spectrometer camera.
To launch the spectrometer, follow these steps:
•Select a camera using the "Select Camera" button
•Current record is displayed in the upper left corner of the preview window.
•Proceed to Spectrometer Control.
OPERATIONS OF SPECTRUM SETUP PANEL
Operations with spectrum records are performed with the data displayed in the graph. The reference spectrum
is the currently displayed spectrum in the graph. The set of coordinates of the currently displayed graph is stored
in the internal memory. The ratio and difference is possible between the spectrum currently displayed in the
graph and the reference spectrum stored in the memory.
Save the reference spectrum –Save the currently displayed spectrum in the background as a reference
View ref. sp. –The reference spectrum can be displayed in one graph with the current spectrum. It will appear
in red with no inner padding when the option is turned on.
Ratio –Graphic information about proportion of current and reference spectrum.
Difference –Graphic information about difference between current and reference spectrum.
2 SPECTROMETER CONTROL
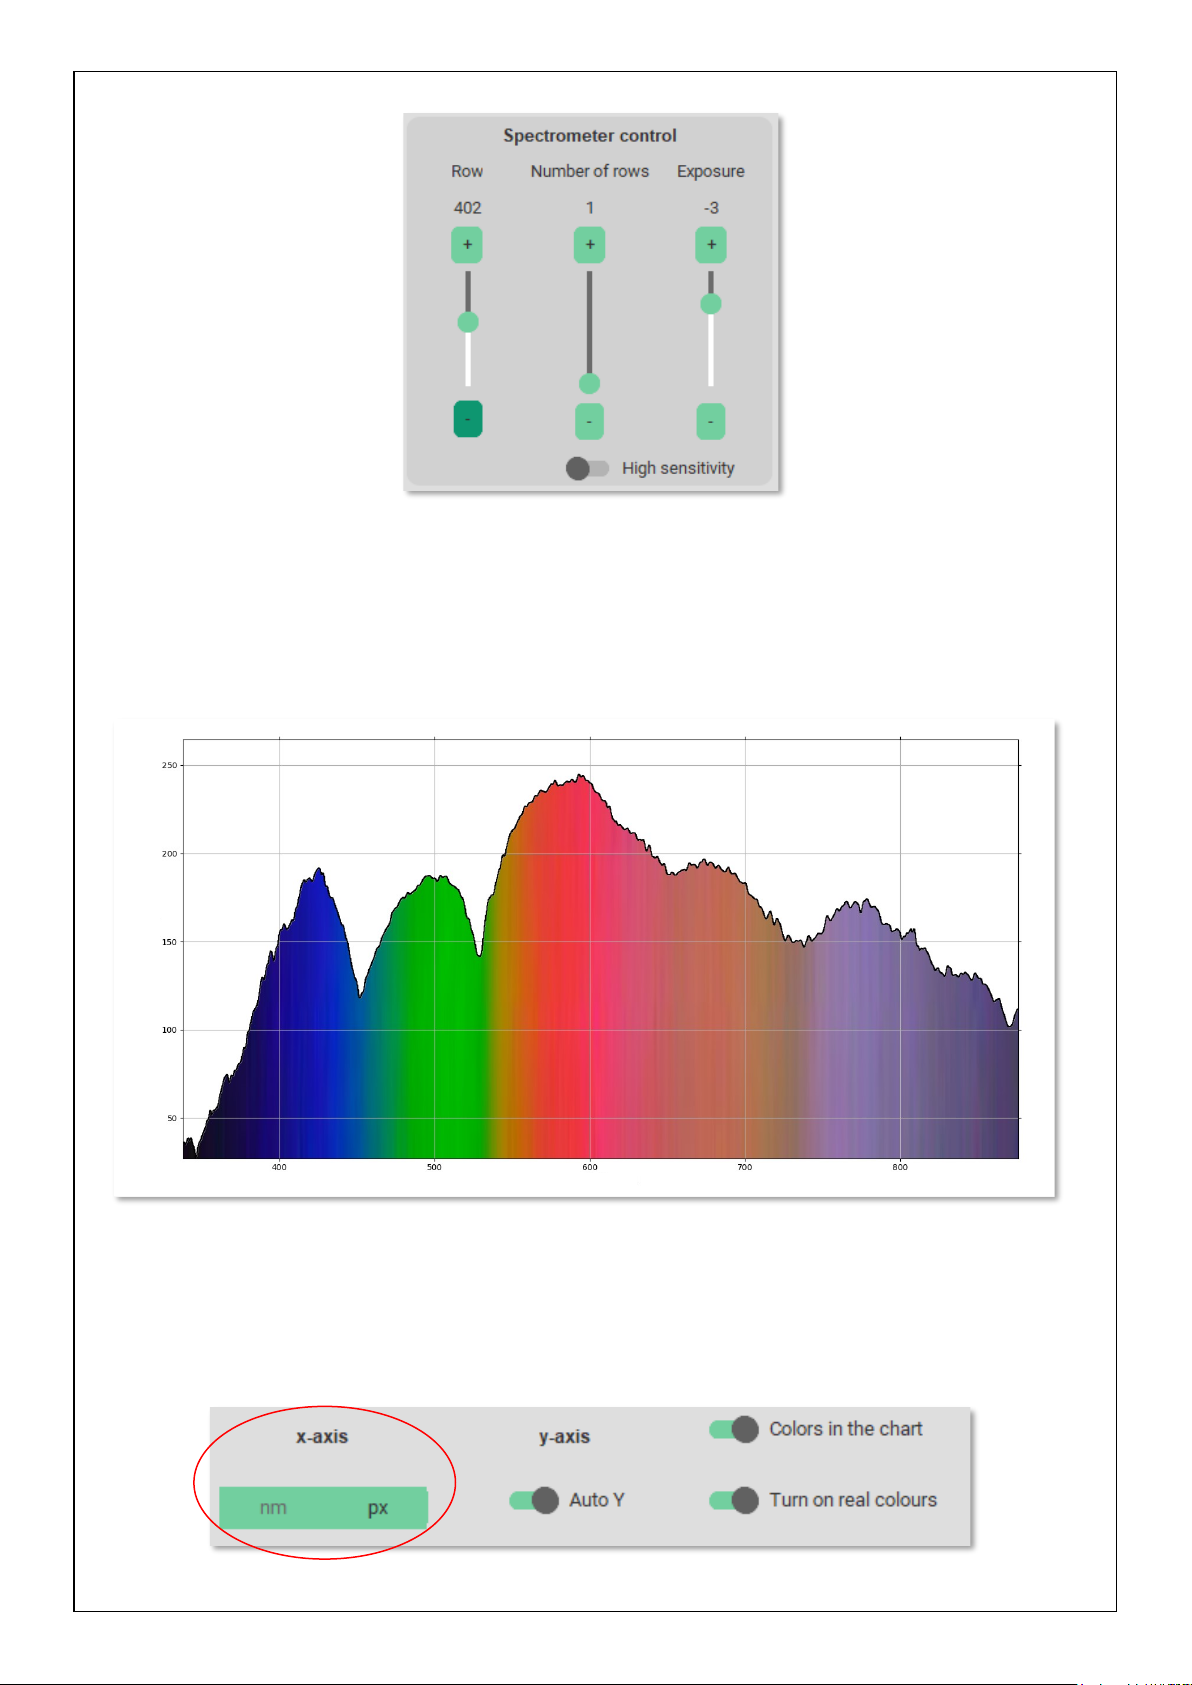
The spectrometer control panel allows you to change the position (Row) and selection width (Number of rows)
of the graphic display of the current record. The change of selection is reflected in the preview window and in
the display of its selected part.

8
When selecting the current recording from the spectrometer camera, it is possible to change the intensity with
the Exposure control element. At low intensities, the sensitivity can be increased using the High sensitivity
button.
The graphic output immediately responds to changes in the values of the control elements of the panel.
3 GRAPH
4 GRAPH SETTINGS
The graphic form of the selected part of the current record has a different form, selectable by the control
elements of the graph panel. The spectrum can be interpreted as a property of image points, recording
pixels, or after calibration of spectrum components with wavelength in nm. The change is accessible by
choosing the units of the independent variable of the graph, the x-axis.
Wavelenght [nm]
Intensity [a.u.]

9
Dependent variable, the y-axis, can be displayed in two optional modes. Automatic mode assigns the range
of the variable a value derived from its lowest and highest value in the graph. Turning off automatic mode
assigns a range corresponding to the lowest and highest value for the selected display method. For normal
graphic outputs, these are values of pixel intensities of 0-255 units.
Fixed y-axis scaling (y-axis range is fixed from 0-255 a.u.).
Automatic y-axis scaling (y-axis range automatically adjusts to the minimum and maximum measured intensity)
Table des matières
Autres manuels KVANT Instrument de mesure
Manuels Instrument de mesure populaires d'autres marques

Endress+Hauser
Endress+Hauser Proline Promag 50 Caractéristiques techniques

Siemens
Siemens SITRANS F Coriolis FCT030 Manuel de la liste des pièces

KLINGER
KLINGER CMF V Series Manuel utilisateur

EXFO
EXFO FTB-2 Manuel d'exploitation et d'entretien

Keysight
Keysight M8290A Manuel utilisateur

ADTEK
ADTEK MW-5 Manuel utilisateur