GoyaLab IndiGo Manuel utilisateur

Institut d’optique d’Aquitaine, rue François Mitterrand - 33400 Talence –France
Version June 20
Handheld modular spectrometer
Introduction:
This document describes the IndiGo modular spectrometer and provides you with instructions for its
questions about this manual.
The IndiGo consists of a modular spectrometer connected by Bluetooth to a smartphone working in
the visible range. Optional modules are available on demand and allow the user to add either a light
source, an optical fiber adapter or a chemical analyzer to the main spectrometer unit. The IndiGo is
designed to be easy to use, compact and portable.
The IndiGo is ideal to record visible spectra directly in the field.
Operation:
Package content
-The IndiGo core module
-USB-C power cord 1m long
-Protective case
Carefully inspect the devices and make sure there is no damage. In the event of a damage, do not use
IndiGo

Institut d’optique d’Aquitaine, rue François Mitterrand - 33400 Talence –France
Version June 20
Material description
1
On/off switch
2
USB-C connector
3
BLE connection LED
4
Loading LED
5
Data transmission signal
6
Pin connection for additional modules
Before use
Before the first use, plug the USB-C power cord to a power supply and connect the other end to
IndiGo’s USB-C connector (2). Once the power charge LED (4) is green, the IndiGo is ready to be used.
Note: if the IndiGo is off, all the LEDs will be off even if the IndiGo is in charge mode. To turn on the
LED during the charge mode battery, please turn on the switch (1).
Then, you will need to download the “GoyaLab” mobile app on the Google Play Store. The
iOS version will be available soon.
Maintenance
After each use, the IndiGo should be stored in its protective case to protect it from dust.
The IndiGo contains a 1000mAh LiPo battery. It is recommended to load the battery at least once every
6 months to prevent electrical damage.
2
1
5
4
3
6

Institut d’optique d’Aquitaine, rue François Mitterrand - 33400 Talence –France
Version June 20
First step
Connexion to the smartphone
1 - Once your IndiGo is fully charged, start the GoyaLab app and select
IndiGo.
2 –Turn on both the Bluetooth and the GPS on the smartphone to
allow the detection of the IndiGo. Wait a few seconds until your IndiGo
appears on the screen. Then select “IndiGo_xx”.
While IndiGo is connected to the smartphone, the BLE connection LED
(3) flashes red and orange. When the LED became orange, the IndiGo
is connected to the smartphone and is ready to be used.
MEASURE menu
Once the smartphone and the IndiGo are paired, the app launches the MEASURE menu.
Basic spectrum functions
Main menu
Live Spectrum
Wavelength axis
(in nm)
Intensity axis
Stop the live mode and
display the last recorded
spectrum

Institut d’optique d’Aquitaine, rue François Mitterrand - 33400 Talence –France
Version June 20
The spectrum of the light measured by the IndiGo is displayed live on this screen.
Note: When the IndiGo is sending data to the smartphone, the data transmission LED (5) flashes
orange and green successively. The flashing speed depends on the acquisition time. The longer the
acquisition time, the slower the flashes.
The spectrum is pre calibrated in wavelength.
Basic spectrum functions of the app
The different functionalities of the MEASURE menu are available from the buttons on
the upper right corner.
Save graph
“Save graph”saves the spectrum displayed on the screen. All spectra are saved in .txt format.
The files are saved in a specific folder: PC\Smartphone xx\ Shared internal storage space
\Android\data\com.minkagency.goyalab\files. This file is accessible either on a PC and on the
smartphone directly.
Subtract background
“Subtract BCK”subtracts the spectrum currently displayed on the screen. This function can be
cancelled just by taping on the “restore BKG” button.
Without subtract
BKG
With subtract BKG

Institut d’optique d’Aquitaine, rue François Mitterrand - 33400 Talence –France
Version June 20
Note: This function is only available when the app is in absolute mode (see § 5.2 f)
Smooth
“Smooth” allows to average the intensity values of the spectrum over N values.
The value of N can be set in the application settings menu:
Autoscale
“Autoscale”scales the spectrum on the vertical axis so that it fills the whole window.
With smooth
function
Without smooth
function

Institut d’optique d’Aquitaine, rue François Mitterrand - 33400 Talence –France
Version June 20
Baseline
“Baseline”allows to subtract the baseline from the spectrum.
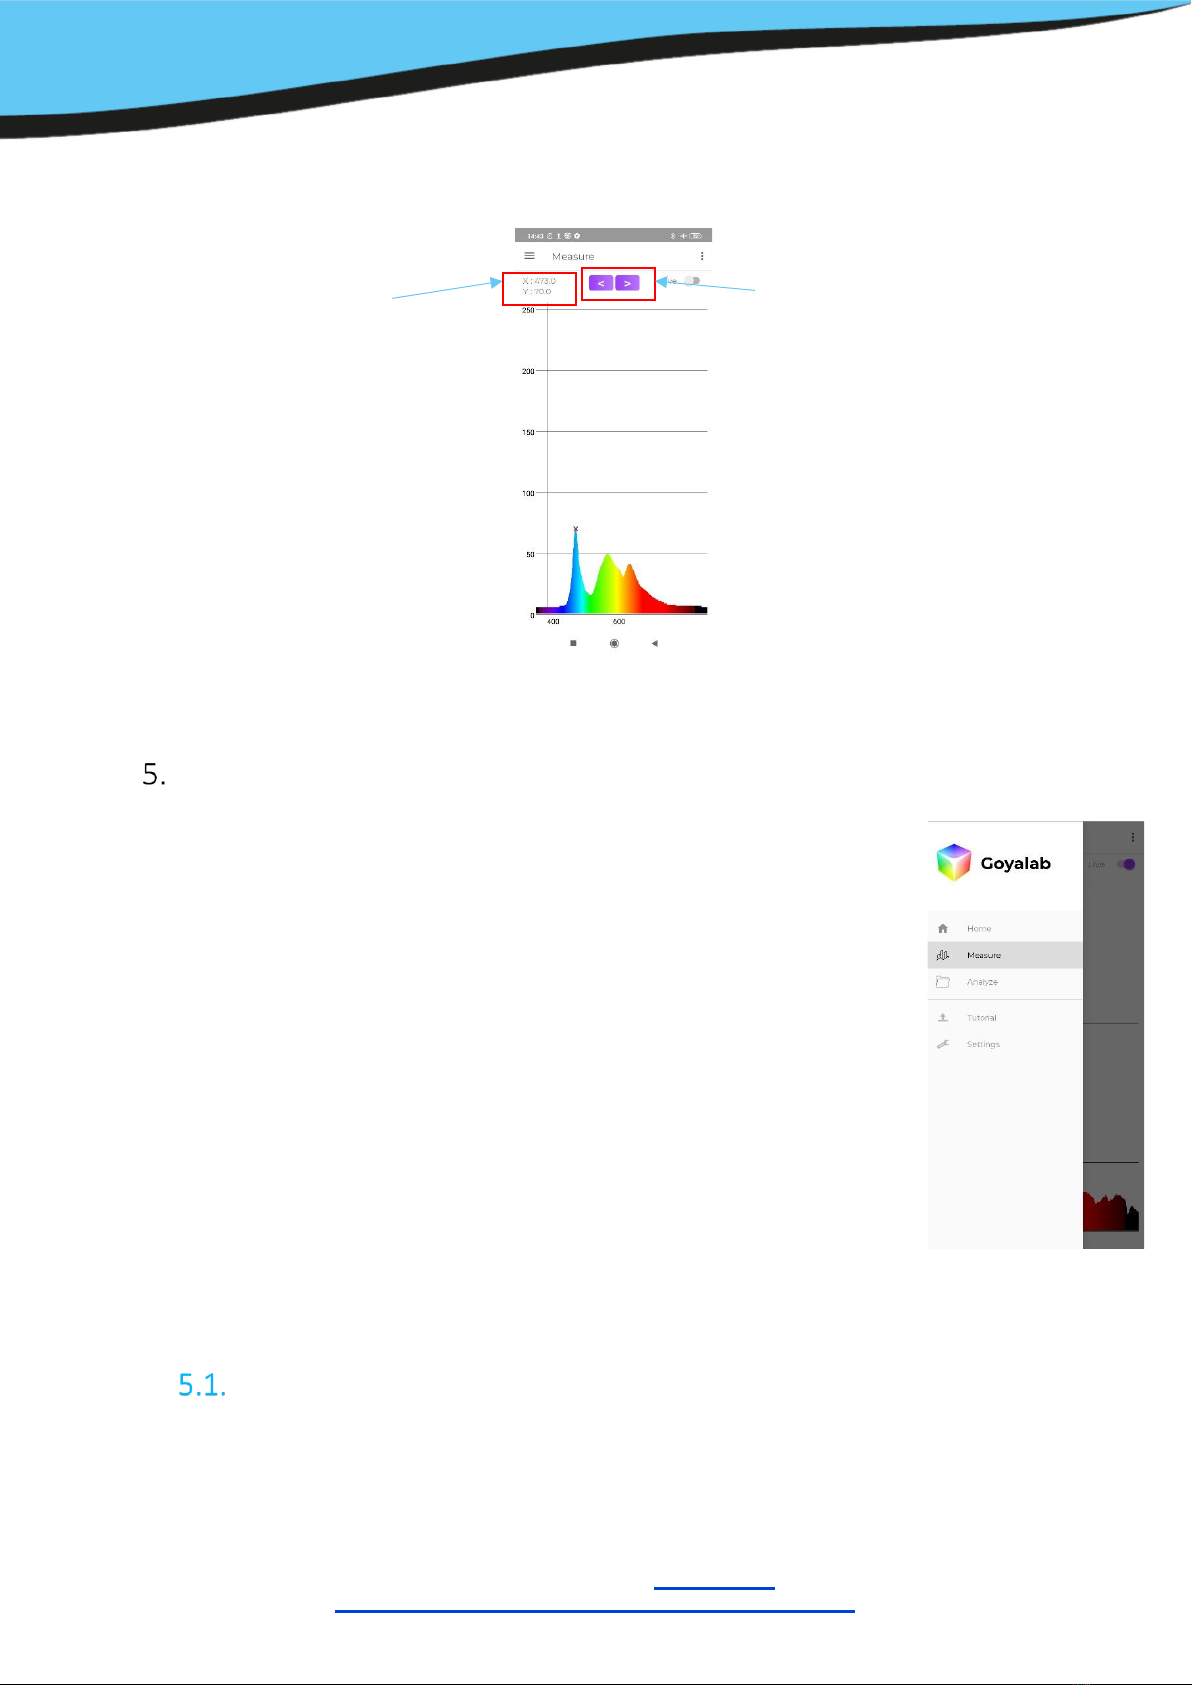
Cursor and Findpeak
“Cursor position” displays a red cross on the screen that indicates to the user the wavelength of the
targeted point and the associated intensity. The cursor can be moved either by using the arrow buttons
(by increments of 1nm) or directly by taping on the screen.
Institut d’optique d’Aquitaine, rue François Mitterrand - 33400 Talence –France
Version June 20
“FindPeak” displays the coordinates (Wavelength in X axis and Intensity in Y axis) of the most intense
peak.
Main Menu
Tap on the main menu button to display the scrolling menu and go from one menu to
another.
5 menus are available on the GoyaLab app:
-“Home”: Displays information about the Bluetooth communication
parameters and the charge level of the battery
-“Measure”:Allows the user to measure spectra
-“Analyze”:Allows the user to display and analyze saved graphs.
Note: All he functionalities of this menu are detailed in Section 5.2
-“Tutorial”:Starts the pairing between the IndiGo and the app and helps
you getting started
-“Settings”:gives the possibility to the user to change the acquisition or
display parameters.
Note: All he functionalities of this menu are detailed in Section 5.2
ANALYZE Menu
Coordinates of the cursor
Arrows to move the cursor by step of
1nm

Institut d’optique d’Aquitaine, rue François Mitterrand - 33400 Talence –France
Version June 20
The ANALYZE menu gathers all the spectra recorded in the MEASURE menu.
a. Display one or several graphs
As many graphs as required can be displayed by checking the purple boxes corresponding to the
spectrum and by selecting “display files”. Once done, a new window like the MEASURE menu is opened
with all the selected files.
Like with the MEASURE menu, some functionalities are available to rescale the axes, subtract a
baseline or display a cursor to read the coordinate of a peak.
Note: when more than 2 graphs are displayed at the same time, the cursor will be placed on the first
graph (by default). To change the graph, select the small arrow to display other spectra and select the
one you want. The cursor will now display the coordinates of that spectrum.

Institut d’optique d’Aquitaine, rue François Mitterrand - 33400 Talence –France
Version June 20
b. Comparison of 2 files
The “compare files” button compares two files by calculating two coefficients based on both a
derivative and an integral calculation. The closer the coefficients are to 1 the more similar the two
spectra. These coefficients are then compared to the threshold set in the SETTINGS menu. If the two
coefficients are greater than their respective threshold, the curves are considered similar (marked with
a “” icon). On the contrary, if at least one of the coefficients is less than the threshold, the curves are
considered different (“” icon).
Note: The Coefficient “I”will mainly focus the comparison of the curve shapes. The variation of the
intensity will not impact the similarity. The coefficient D will also take into account the intensity
difference between both curves.
c. Set as a background
This function displays a spectrum directly on the MEASURE screen. To activate this function, press
long on the spectrum you want to display and select “set as a background” measure.
Note 1: only one spectrum at a time can be displayed as a background
Note 2: it is advisable to cut off the ‘rainbow’ display mode to clearly see both spectra (see Section
5.2.c).

Institut d’optique d’Aquitaine, rue François Mitterrand - 33400 Talence –France
Version June 20
Note 3: The spectrum displayed as a background will be automatically removed once the user leaves
the MEASURE screen.
.
d. Delete and rename
To delete or rename a spectrum, swipe left on a spectrum to bring up the Edit or Delete buttons.
SETTINGS menu
The different functionalities of the SETTINGS menu are described hereafter:
a. AutoExposure
The Acquisition time corresponds to the recording time of a
spectrum.
It can be managed automatically by the app or imposed by the user.
When the switch is on Auto, the exposure time is managed automatically by the app. When the switch
is on Manual, the exposure time will be the one indicated in the text box.
The acquisition time must be given in ms and can go from 1ms up to 2000ms. The user has to click on
the following symbol to save the acquisition time.
Table des matières
Manuels Instrument de mesure populaires d'autres marques


Endress+Hauser
Endress+Hauser Proline Promag 50 Caractéristiques techniques

Siemens
Siemens SITRANS F Coriolis FCT030 Manuel de la liste des pièces

KLINGER
KLINGER CMF V Series Manuel utilisateur

EXFO
EXFO FTB-2 Manuel d'exploitation et d'entretien

Keysight
Keysight M8290A Manuel utilisateur

ADTEK
ADTEK MW-5 Manuel utilisateur