5
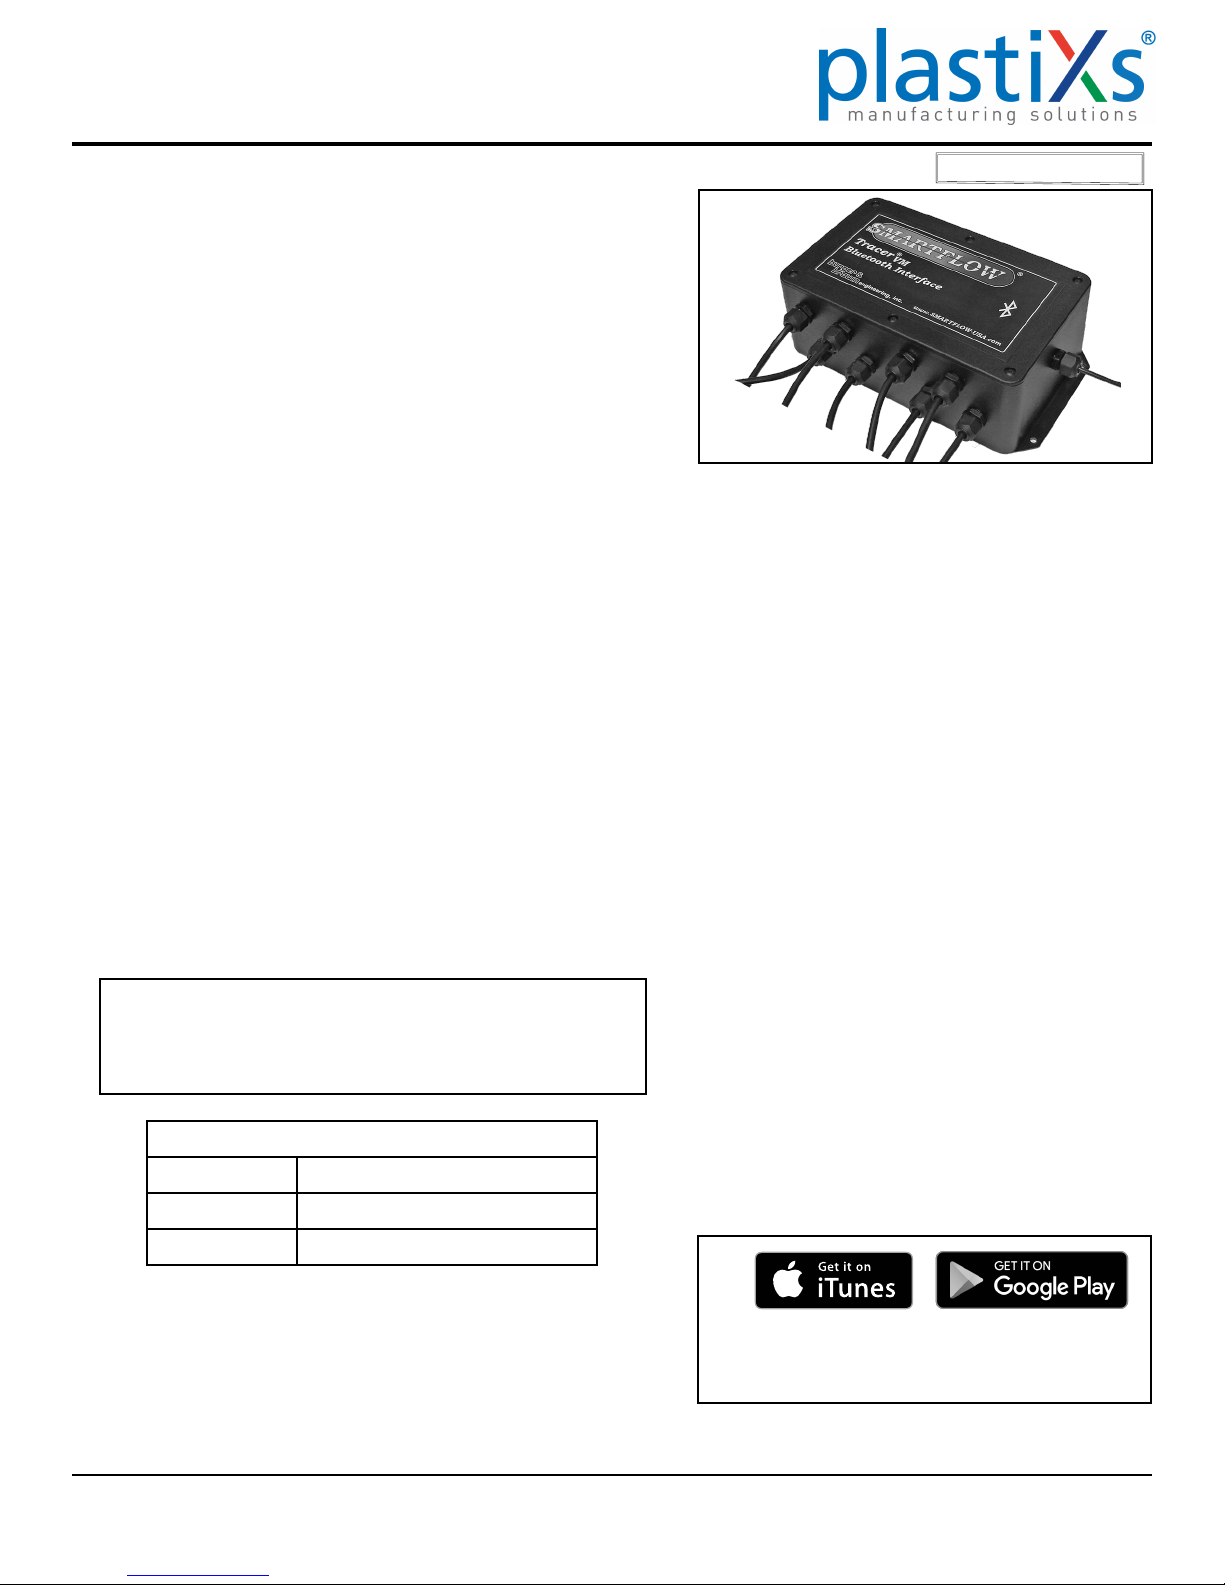
Tracer®
VM with Bluetooth Interface Instruction
The Smartow Data Logger collects and displays temperature
and ow rate information from TracerVM Bluetooth Interface
Modules. The information is saved to a .csv le that can be
imported into a database or spreadsheet for future analysis or
process reference. Medical molding applications or other critical
molded parts that require process verication or traceability will
benet from this technology.
The Data Logger can collect from up to 10 Bluetooth Interfaces
at once. Each Bluetooth Interface connects up to 8 owmeters for
a maximum of 80 cooling water lines. One .csv le is created for
each Interface. Files are only comma delimited.
The software is provided as a .zip le. Extract the installation
program and install onto a computer in the default location or
select a folder according to your preference. Executable le name
is "SmartFlow Data Logger.msi".
There are two viewing screens: "Home View" and "Session
View".
Home View: Metric or English Units and Interface Modules are
selected. A graph of the ow rate and temperature is available for
each Interface. The user selects the area on the screen for each
Interface from the list of those available.
Session View: Session options and le output are congured.
Selectable options are:
•Manual or Scheduled Duration
•Session Name
•Sensor Names
•Log Rate in seconds
•Enable or Disable Alarms and Audible Indication
•Metric or English Units
•Graph View
•Output File Name (.csv)
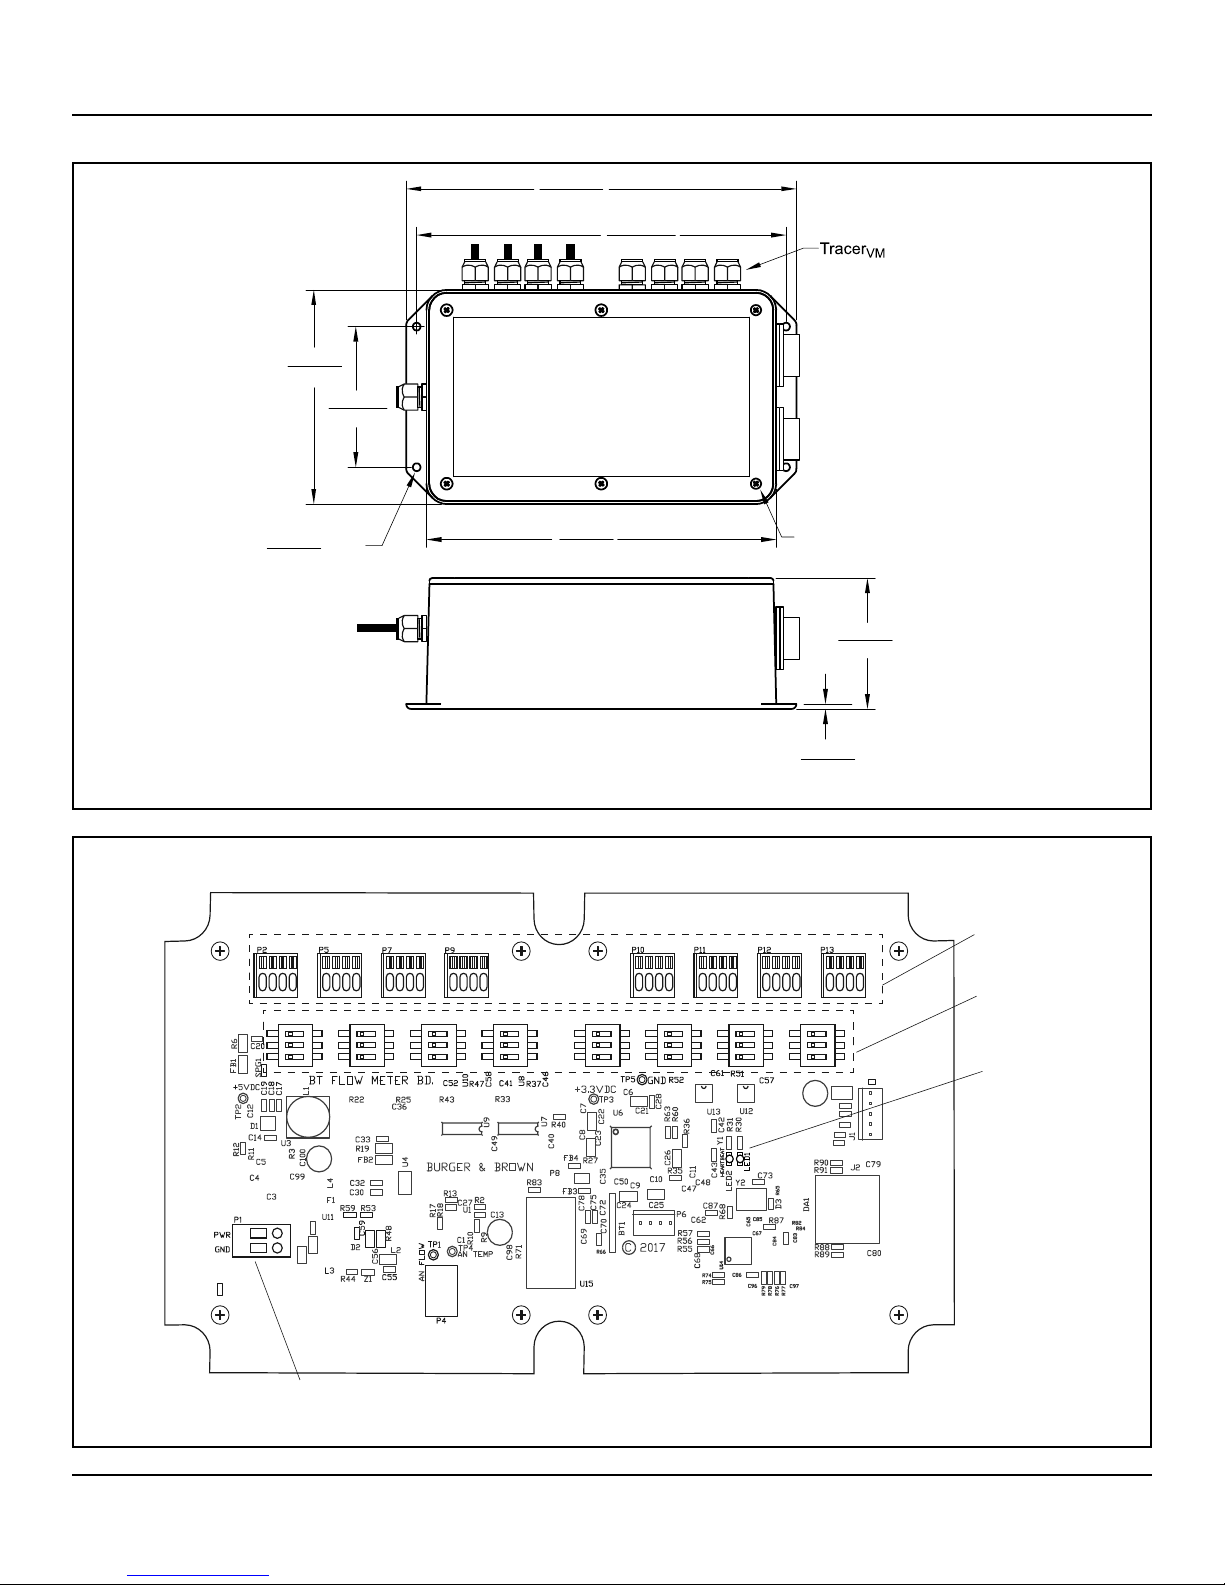
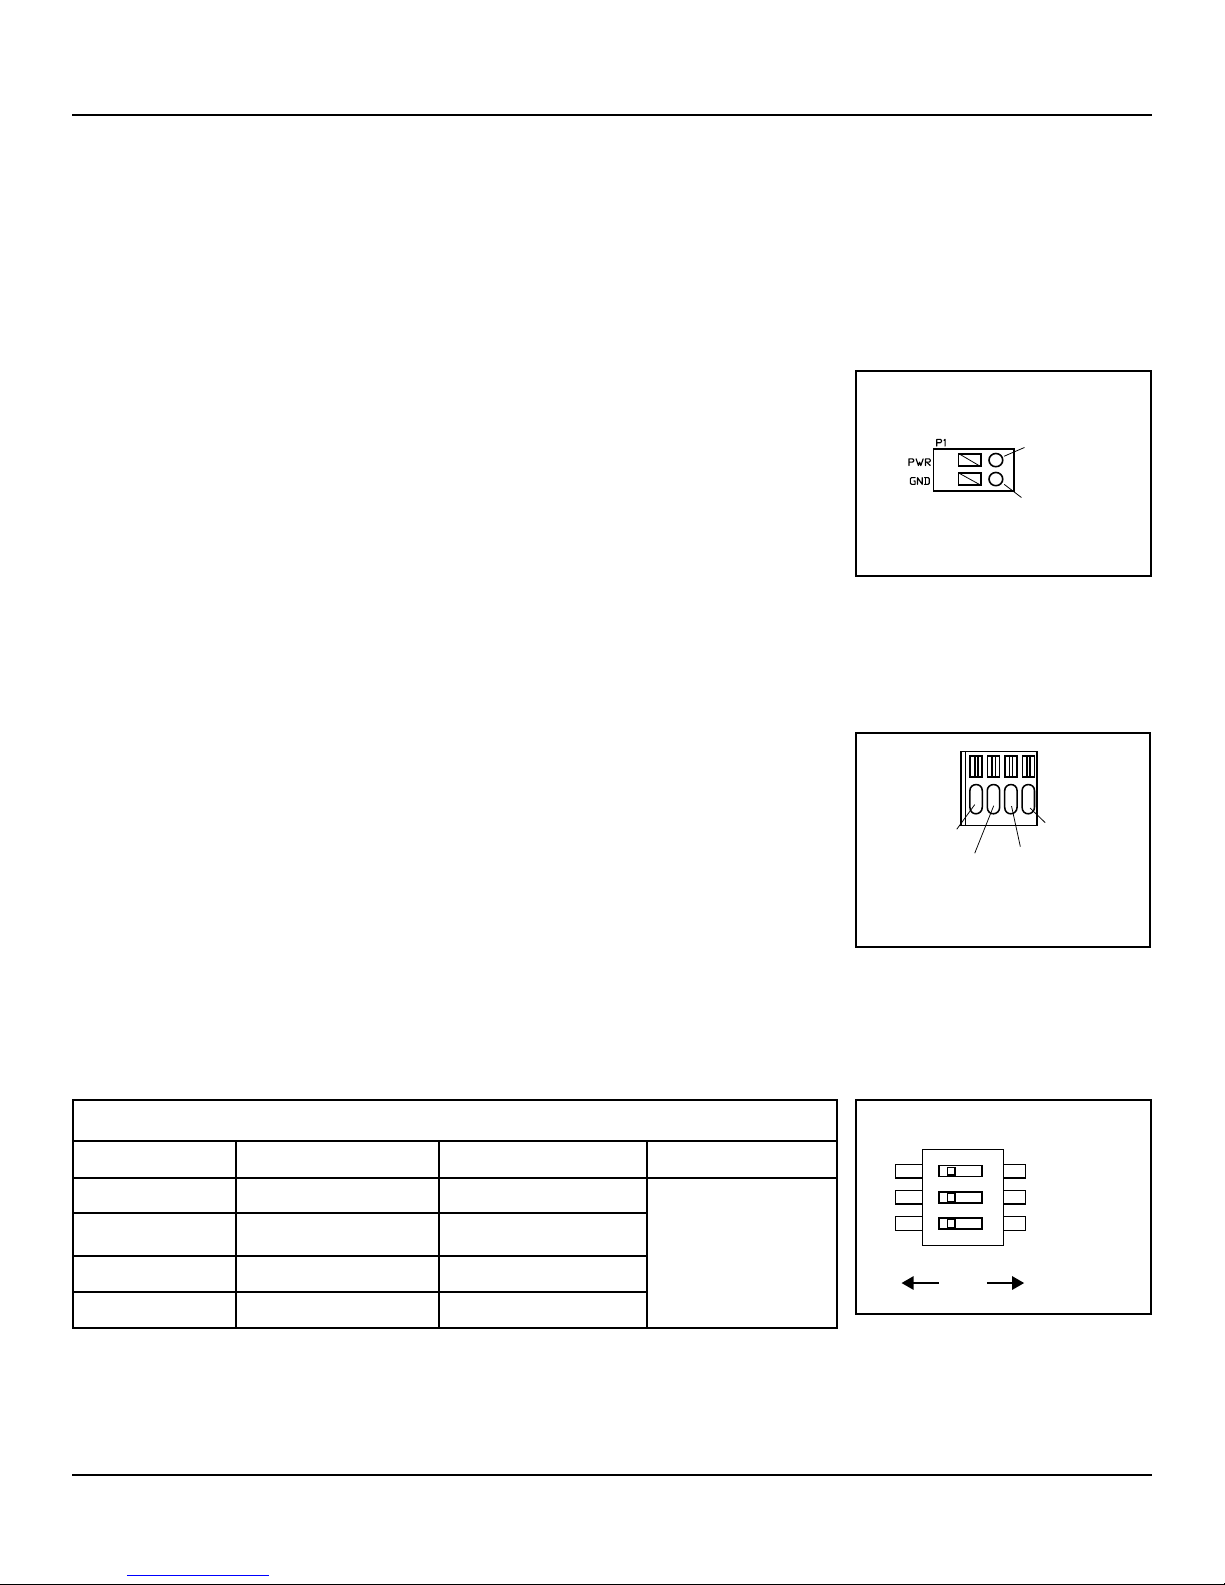
Start the Smartow Data Logger Application. Check that each
TracerVM Bluetooth Interface is connected to 8 to 28 Volts DC
power supply with earth ground and connected to the local
network.
1. Highlight the "Home View" box. Select your preferred units
(English or Metric). Changing units after a session is started
will clear all data without saving.
2. Select the name of a TracerVM Bluetooth Interface from the
list at the top of the screen. Select the area of the home view
screen for individual interface display. Once an interface is
assigned to the home view, the name in the list will change
from yellow to green. Note: There are up to 10 possible
graph locations on the "Home View" screen. The number
of locations you can select is determined by the number of
Interfaces connected to the local network. If one Interface is
connected, there will only be one available graph location.
3. To start a logging session, the Interface must be assigned
in the "Home View" with visible graph (steps 1 & 2). Select
the "Session View" box. Select the Interface from the list of
available modules in the top window. Then select "New Tab".
4. Once a session has been started, you can start either a
Manual Session or a Scheduled Session.
5. Once a session has been opened, the software begins
recording data that can be saved by starting a "Manual
Session". This rolling history is gathered for up to 72 hours
without a session being actively recorded. This is available
as long as a session is open and the program is running.
Note: If units are changed on a session view, the rolling
history will be cleared.
6. The session name, as well as the names of each sensor can be
changed by clicking the Session/Sensor names button.
7. Log Rate is the rate at which data is collected in terms of
seconds between data points. The value can be set from 1
second up to 3600 seconds (1 hour).
8. The session controls section allows you to turn alarms on/o
as well as turn the graph on/o for individual sensors. The
audible indication selection turns the audible alarm on/o.
Units must be set to either English or Metric before a session
is started. Once a session is started you will not be able
to change units. The Graph View provides available time
ranges (30 seconds through 8 hours or cumulative) for Real
Time Graphs visible in the Session View.
9. Once alarms have been enabled they can be adjusted in the
"Alarms" region. If an alarm is triggered, a pop up warning
will display as well as an icon underneath any sensor with
an active alarm. In addition, the session tab will turn red to
indicate which Bluetooth Interface is experiencing an alarm.
Alarm indicators are visible only during a logging session.
10. For a manual session, once the desired data has been
recorded, select the end session button to save the data. For
a scheduled session the data will save automatically. Once a
session is started, data is recorded to a .csv le. This le is
updated after every data point is recorded. Do not open the
le while the current session is in progress. To close out of a
session simply select the red "X" in the session setup area.
Data Logger Software
General Description