Doc# 100928 • HI-903-Shaker • October 2017-RevA Page 6 of 33
Report Generaon Workbook
Calibraon data can be saved into the HI-903’s internal memory and easily
exported to a personal computer using a USB Flash Drive.
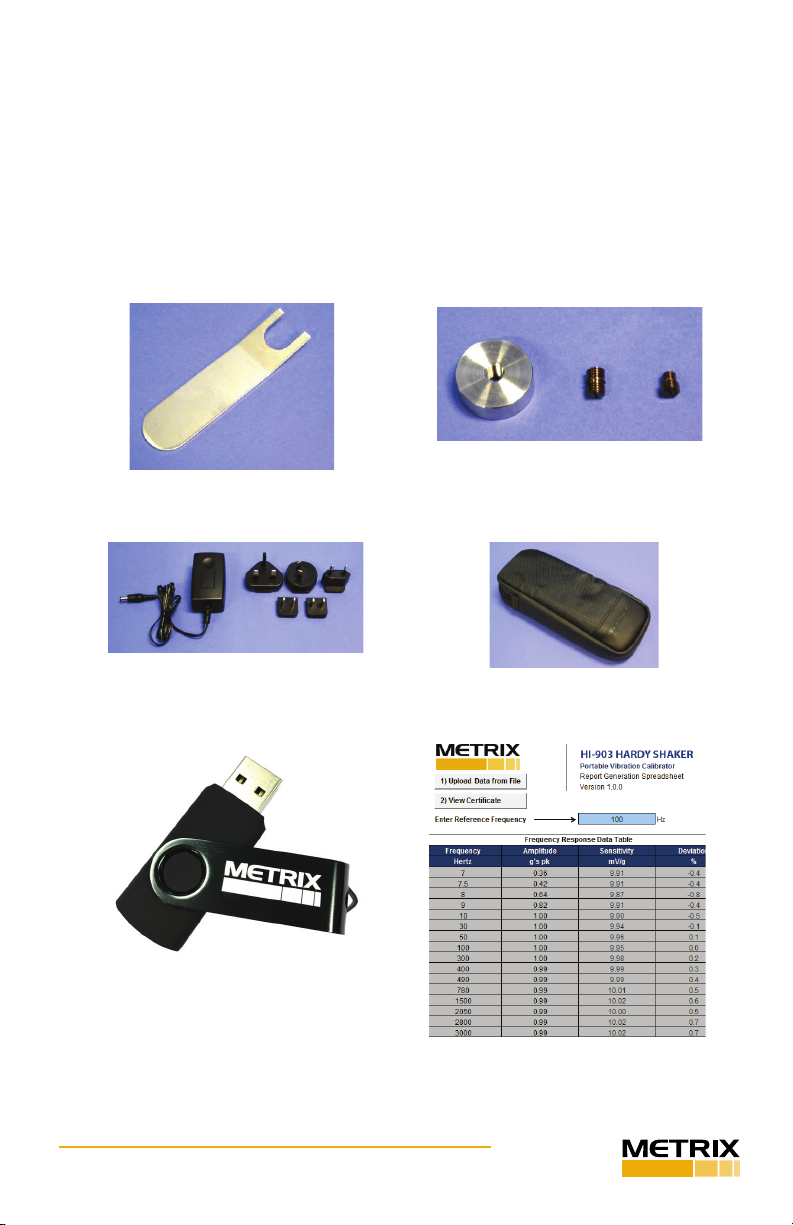
The HI-903 Portable Vibraon Calibrator includes a pre-formaed USB Flash
Drive with a Microso Excel Report Generaon Workbook for the creaon of
customizable calibraon cercates. The Excel le provides an intuive interface
which allows a user to create and print a calibraon cercate with just a few
mouse clicks. In order to use the le, make sure macros are enabled, otherwise
Excel won’t be able to load data and create the cercates.
The Excel workbook consists of the following worksheets or tabs:
• FRData – Use this tab to create a frequency response cercates in just 2
steps:
1. Clicking on Import Data from File buon prompts the user to select and import
a .pvc calibraon data le previously created by the HI-903
2. Once data is loaded into the table, click View Cercate to see and print a
calibraon cercate containing the frequency response data (the reference
frequency for the calibraon cercate is 100Hz and can be changed by the
user as needed)
Note: If tesng a charge-mode accelerometer and calibraon cercate
in pC units is desired, click the box at top le of the FRData tab and enter
the sensivity of the charge amplier in the “mV/pC” box located at cell
D8. See the secon “Calibrang Charge-Mode Accelerometers” for more
informaon.
• LINData – Use this tab to create linearity response cercates. The worksheet
applies linear regression to interpolate the data. The Max Linearity is calculated
for the worst deviaon of a parcular point from the best-t straight line (BFSL)
of all tested points. The table also displays the specic results at each test level.
The LINData worksheet has 2 tables. The le table should be used for creang
dynamic linearity data calibraon cercates in just 2 steps:
1. Click on Import Data from File to select and import a .pvc calibraon data le
previously created by the HI-903
2. Once data is loaded into the table, click View Cercate to see and print a
calibraon cercate containing the linearity response data. The worksheet
expects the data points to be taken at the same frequency (speed). A checkbox
opon labeled Set Y-intercept to zero is available to force the interpolaon to
go through the origin point.
The right table in the LINData worksheet is used to create a DC proximity probe
curve or linearity cercate for 4-20 mA vibraon transmier. Creang a DC
proximity probe curve requires the proximity probe adaptor kits and a DC
voltmeter (not included). Creang a linearity cercate for a 4-20 mA vibraon
transmier requires DMM set to DC current input. A 24 VDC power supply may
also be needed:
1. Select the appropriate vibraon scale (Acceleraon, Velocity or Displacement)
by clicking in cell H12 and selecng from drop down menu.
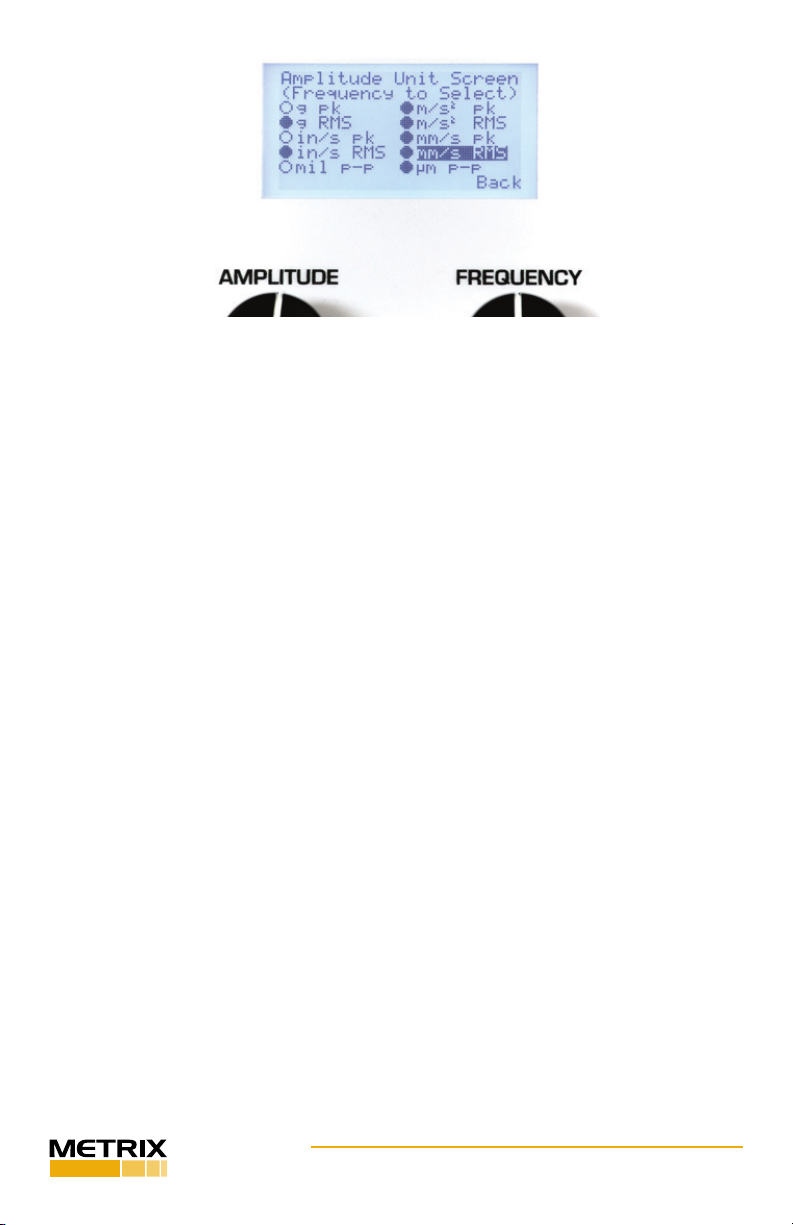
2. Select the appropriate units (g’s pk, g’s RMS, m/sec2 pk, m/sec2 RMS, in/sec pk,
in/sec RMS, mm/sec pk, mm/sec RMS, mils p-p or µm p-p) in cell H13. Make
sure cell H12 is set to the right scale rst.
3. Enter known amplitude and output for the rst test point next to “Starng
Point” and repeat for each addional test point moving down the table.
Once data is entered into the table, click View Cercate to see and print a
calibraon cercate containing the linearity response data.
• FRCert - Displays the frequency response calibraon cercate using the